
David Stewart
- Advisor at Approov / Former CEO of Approov
30+ years experience in security products, embedded software tools, design services, design automation tools, chip design.
Approov API Threat Protection protects the APIs which service your mobile apps from abuse and fraud by unauthorized bad actors. We talk to customers about how Approov authenticates genuine mobile app instances without requiring hidden secrets or design decision making in the app. We discuss the simplicity of integrating it into your app and deploying it in production. We even talk about the scalability, redundancy and resilience built into the Approov cloud service. However, what we don’t talk enough about is our metrics, a required feature to monitor and manage your service. With this article, we will give our metrics the description they deserve.
The dynamic liveness of Approov, both the solution itself as well as the metrics data it produces, is a key capability in understanding how your app is being used or is being bypassed. Traditional shielding and obfuscation approaches may put in place protection for your app when it is first created, but they provide little or no feedback about what is happening in the field. Further, as threats evolve and changes are needed, any enhancements to this protection will require a new app release - with the ensuing delay of several weeks while all genuine customers upgrade their installations. Remember that the bad guys don't upgrade their apps until their exploits stop working.
Beyond the metrics features that we will discuss in this article, Approov has an over-the-air (OTA) update capability which puts the app owner in charge of a wide range of remote upgrade paths. These can be vital in reacting to live situations in the field, situations which you may notice through the data provided in the metrics graphs. The OTA channel has an instant effect and can be used for updating your security policies, adding new security detections based on immediate and present threats, and for updating your certificate pins if you are taking advantage of the dynamic pinning capability which is a standard part of Approov.
Approov metrics, also known as analytics, show you what is happening in your service, historically and right up to the present minute. The graphs that we will describe in this article are a very useful tool in understanding both the big picture of the trends in your customers’ usage of Approov, but also the real-time details of specific attestations at specific times. Therefore you should think of the metrics as a dashboard through which you can make a quick check that everything looks calm in your service, or through which you can investigate any aspect in more detail through the various graphs and options available to you.
The most likely initial information you will want is the volume of unique users (devices) who are using your service. The best way to see this data is to use the Billing Usage graph. Various graphs that we will refer to in this article can be selected from the pulldown menu in the top left corner of the dashboard.
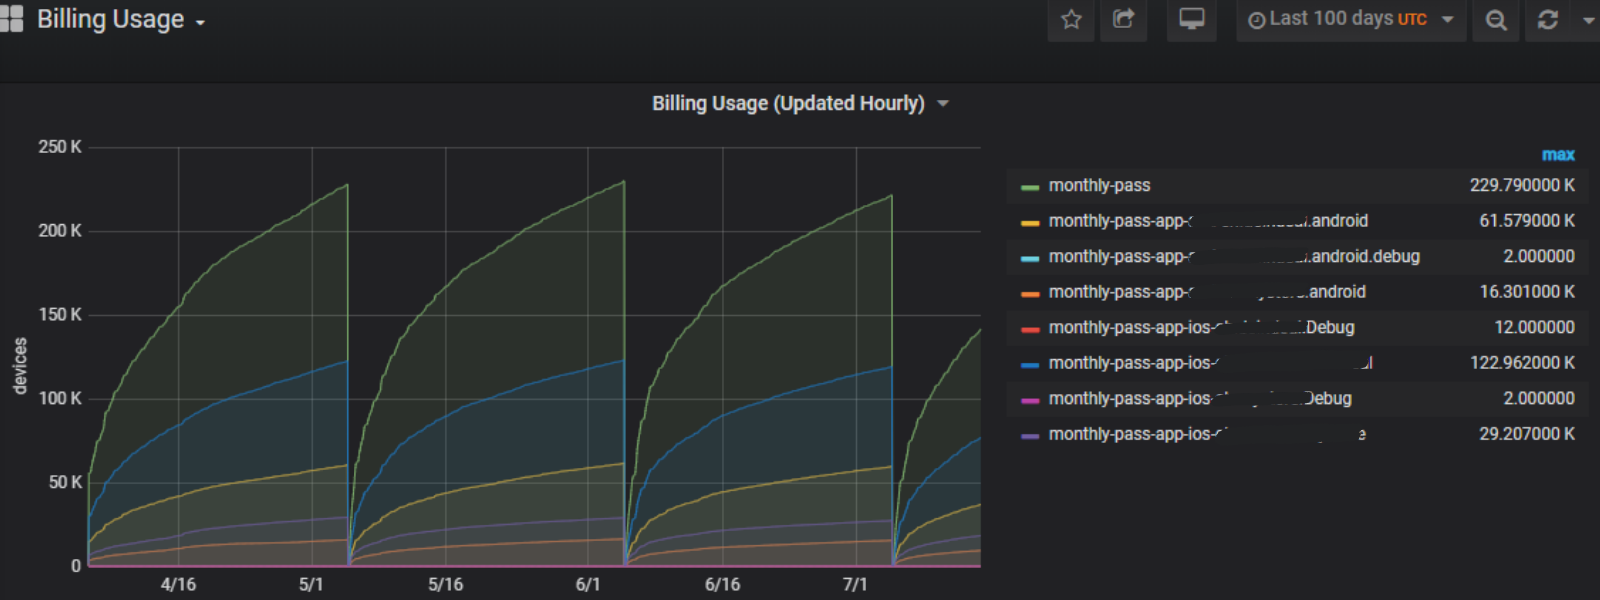
You can of course select the time window that you want to see using the pulldown in the upper right of the dashboard, although this particular one defaults to the last 100 days, enabling you to see the last 3 billing cycles. Usage numbers reset at the end of each billing cycle. Not only does this graph show you the total users over time, but it also details which platform (Android or iOS) and which app packages are being used. You can click on any of the text descriptors on the right to see just the data for that app package.
Next you probably want to understand more details on the passes and fails going on within your Approov service instance. There are a number of ways to explore this data but the best place to start is the Monthly Metrics graph. As you might expect, this view defaults to 31 days of activity, covering the most recent billing cycle, but you can alter the start and end points of the graph using the top right pulldown.
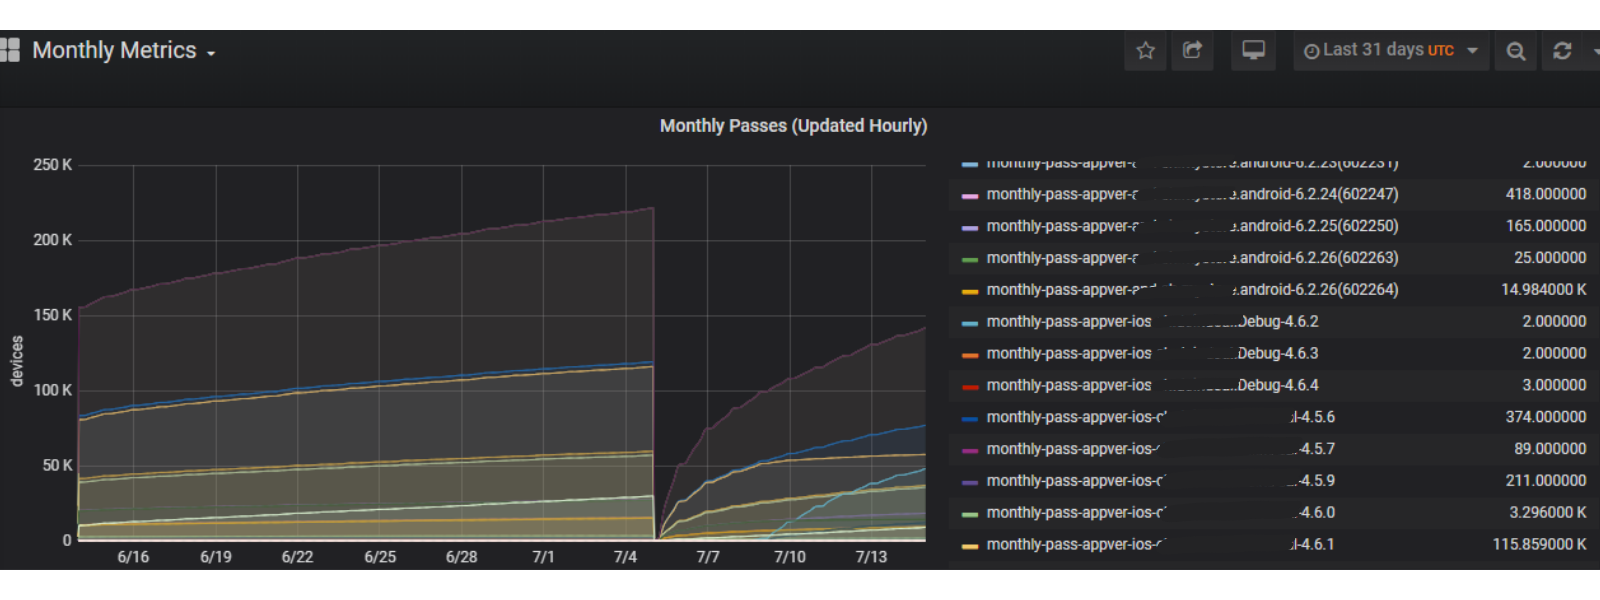
In addition to the app package which your customers are using, you can also analyze the registered app versions breakdown as you can see above. This may help you to understand when you can de-register a particular old app version.
Regarding Approov attestation failures, this can often be more interesting than the pass data. In addition to the absolute numbers, you can examine the device properties of those that failed as you can see below.
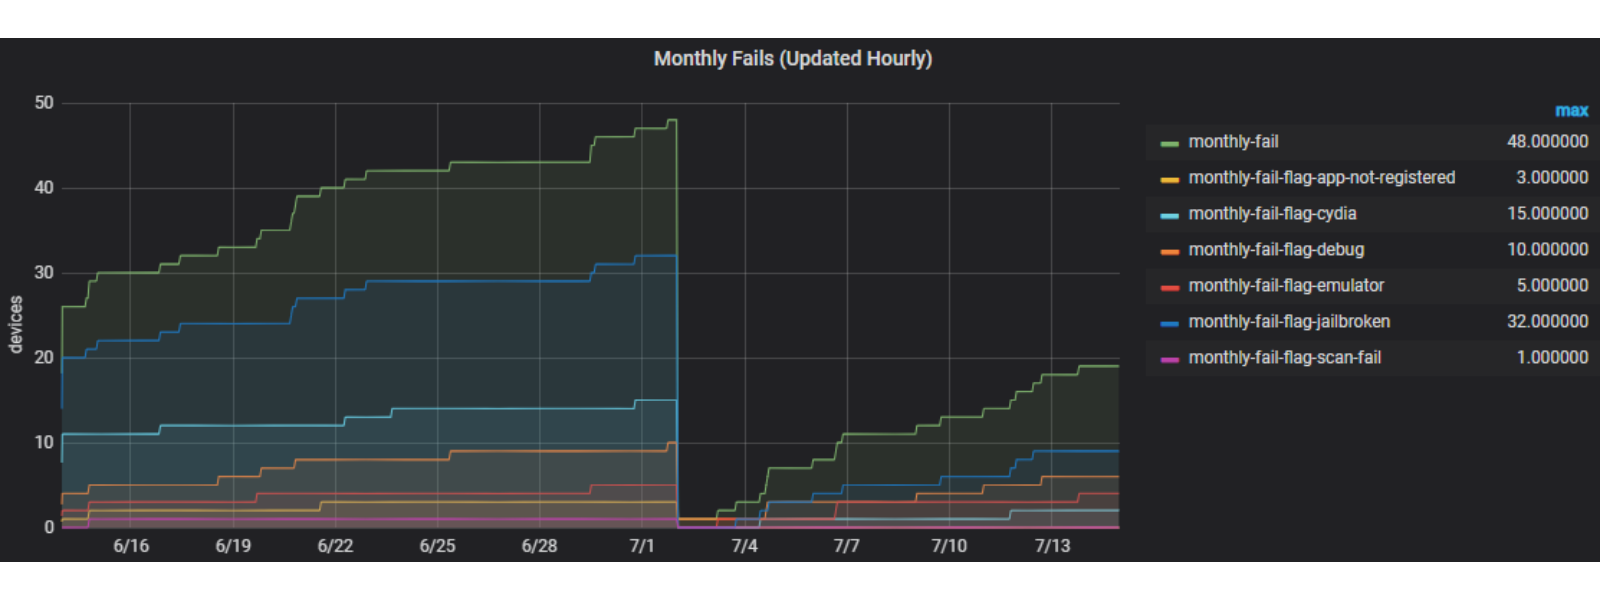
Remember that the impact of detected device characteristics shown will vary, depending on what security policy you have set up. In the case above we can see detection of debuggers, emulators, jailbroken phones, and more; and we can also see recordings of situations where an app version attempted to attest when it had not been registered with the Approov cloud service - something which often happens during the app development phase.
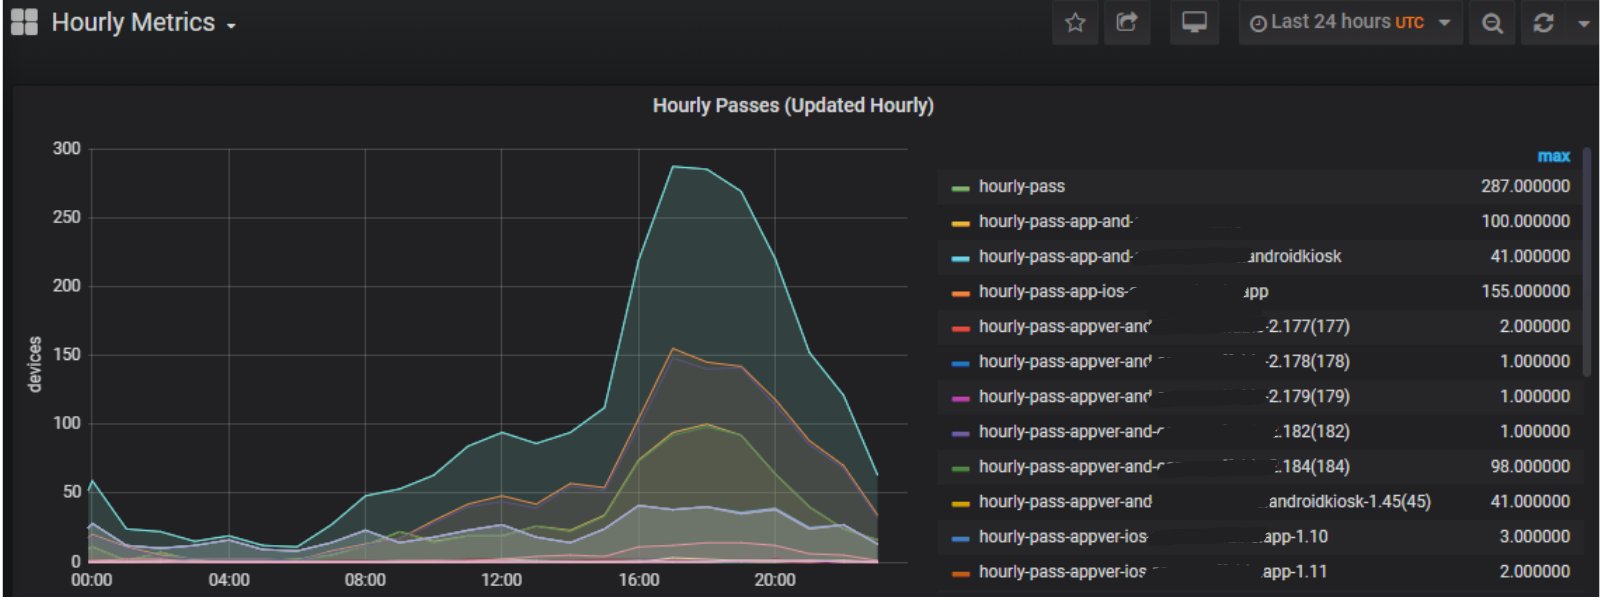
So far we have looked at Monthly Metrics, but Daily and Hourly Metrics are also available. Below is an example of a 24 hour view of hourly pass data.
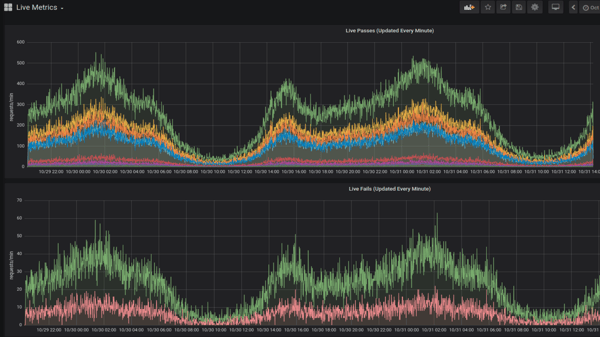
We can go even more detailed than this though, and start to examine the Live Metrics graph. Unlike the previous graphs, all of whose data is updated hourly, the Live Metrics graph data is updated every minute.
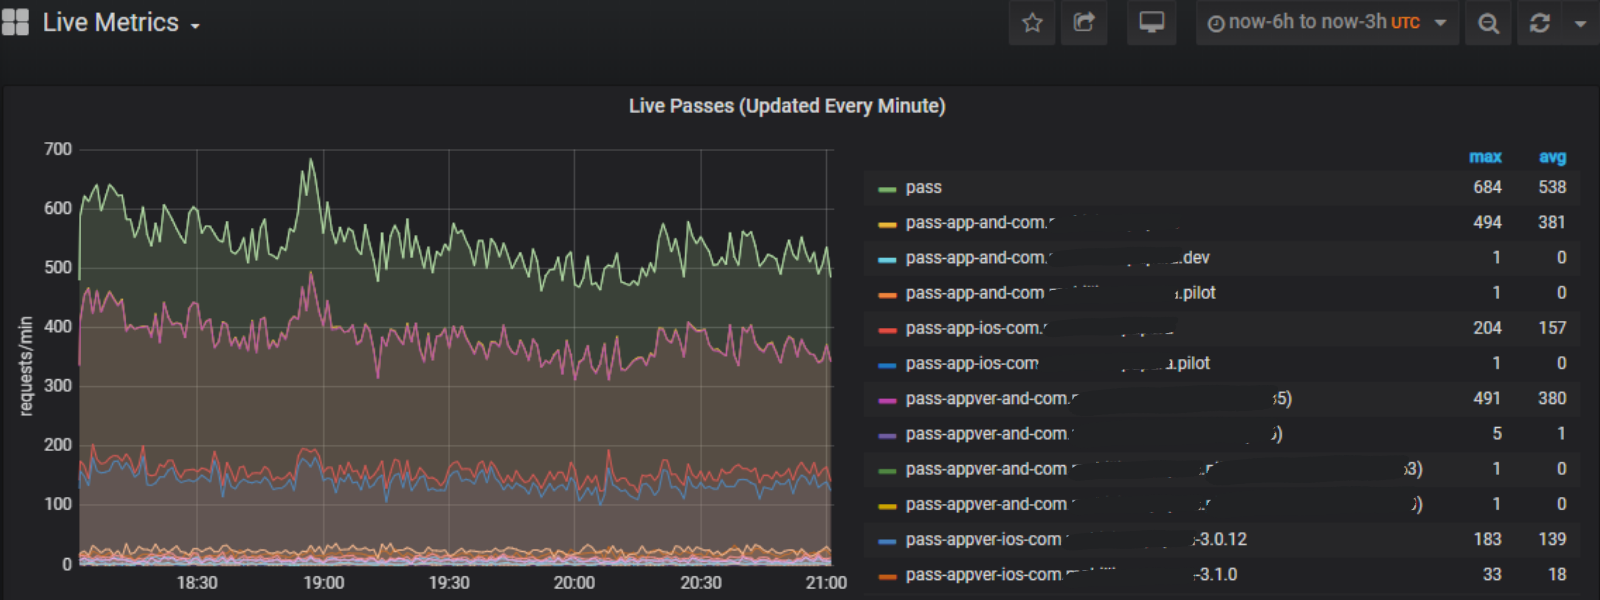
Above you can see an example of a 3 hour window of live passes data and below is the fail data over the corresponding period. You can even zoom right into individual failures if you want to examine the detail further.
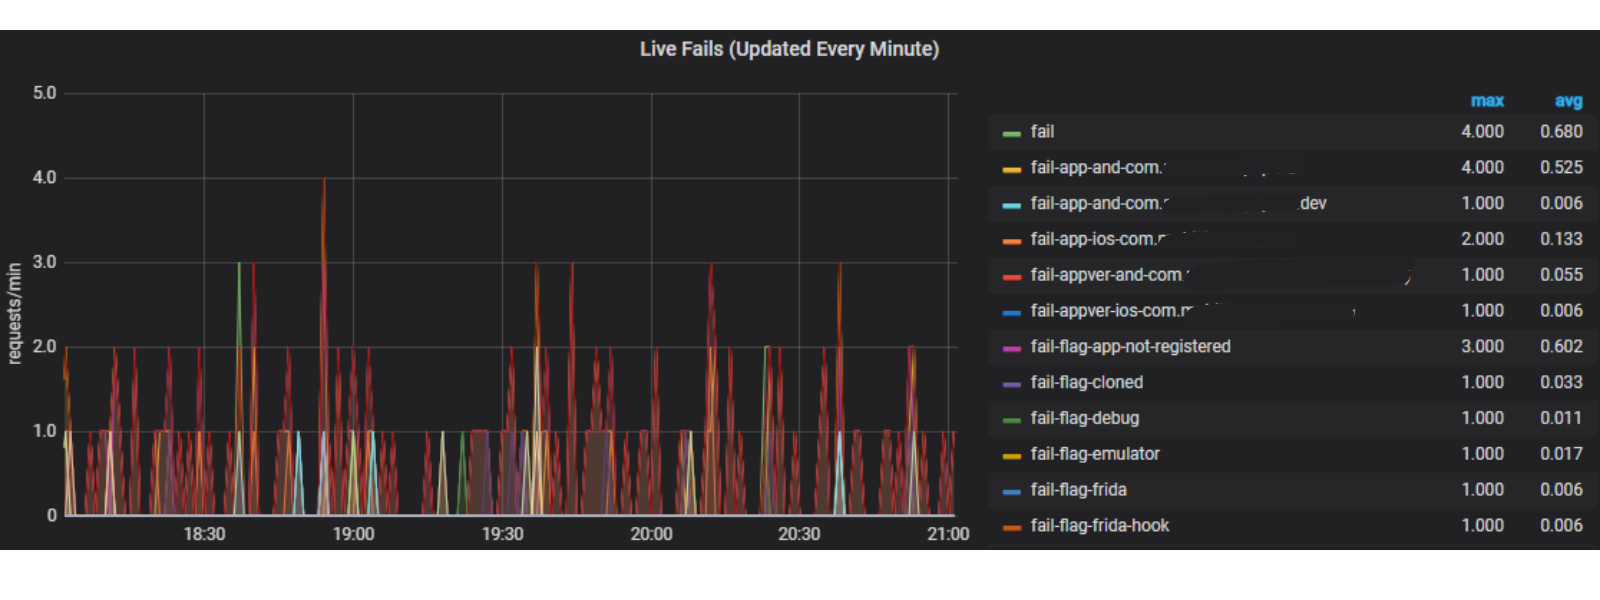
This level of detailed real-time pass and fail data is of course useful when you have Approov deployed in live apps since it may inform you of the attacks which are being repelled. However, another use case when this data is particularly helpful is when you are bringing Approov up in a new app. Taking an action with the app and being able to see immediately the feedback in the metrics can be incredibly helpful in understanding what is happening. Imagine that you have integrated Approov perfectly, as far as you can tell, but still you get invalid Approov tokens. A quick look at the real-time metrics may produce an “A-ha” moment as you realize that your debugger is still attached to the app, something that Approov would see as a ‘bad’ app runtime environment if the default security policy is being used.
There is one further graph that is available to you, and that is the SDK Metrics - which is also real-time data. The SDK Metrics give you details on SDK calls and SDK fetches which are being made from your app, and the SDK libraries which are being used. Examples of these graphs are shown below.
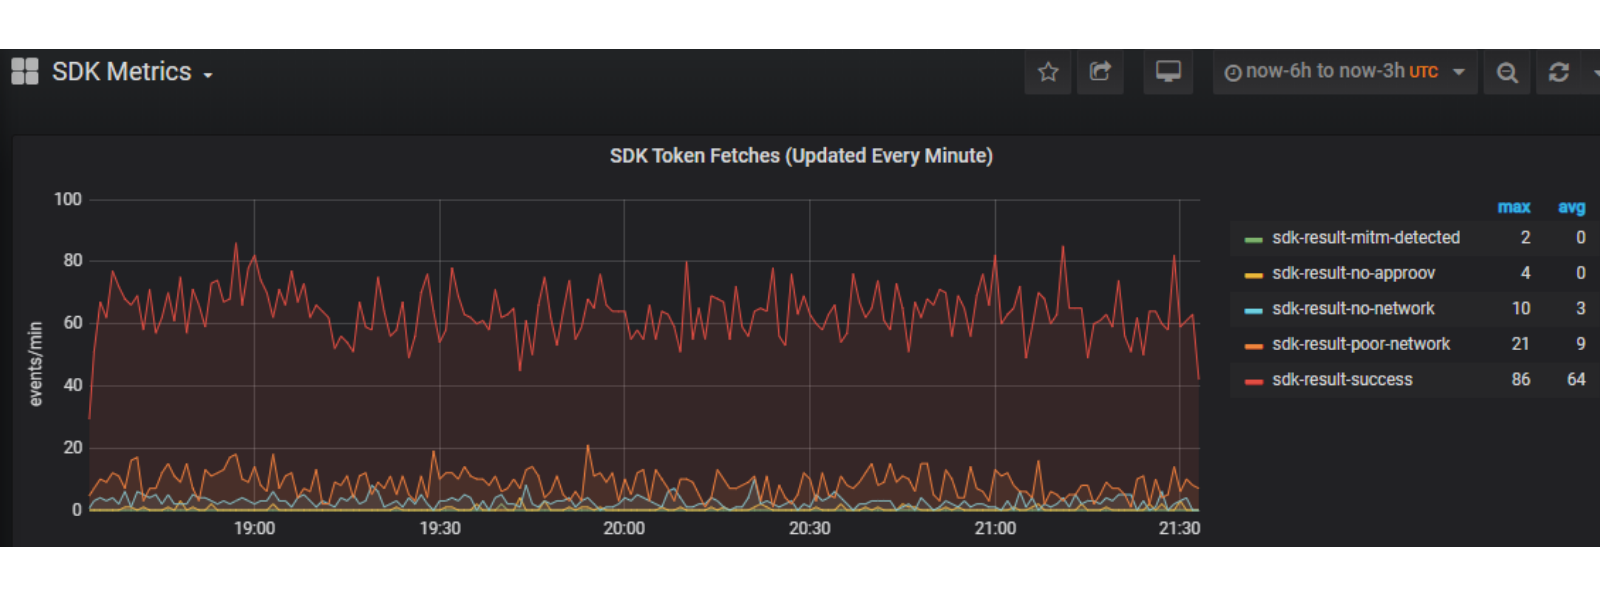
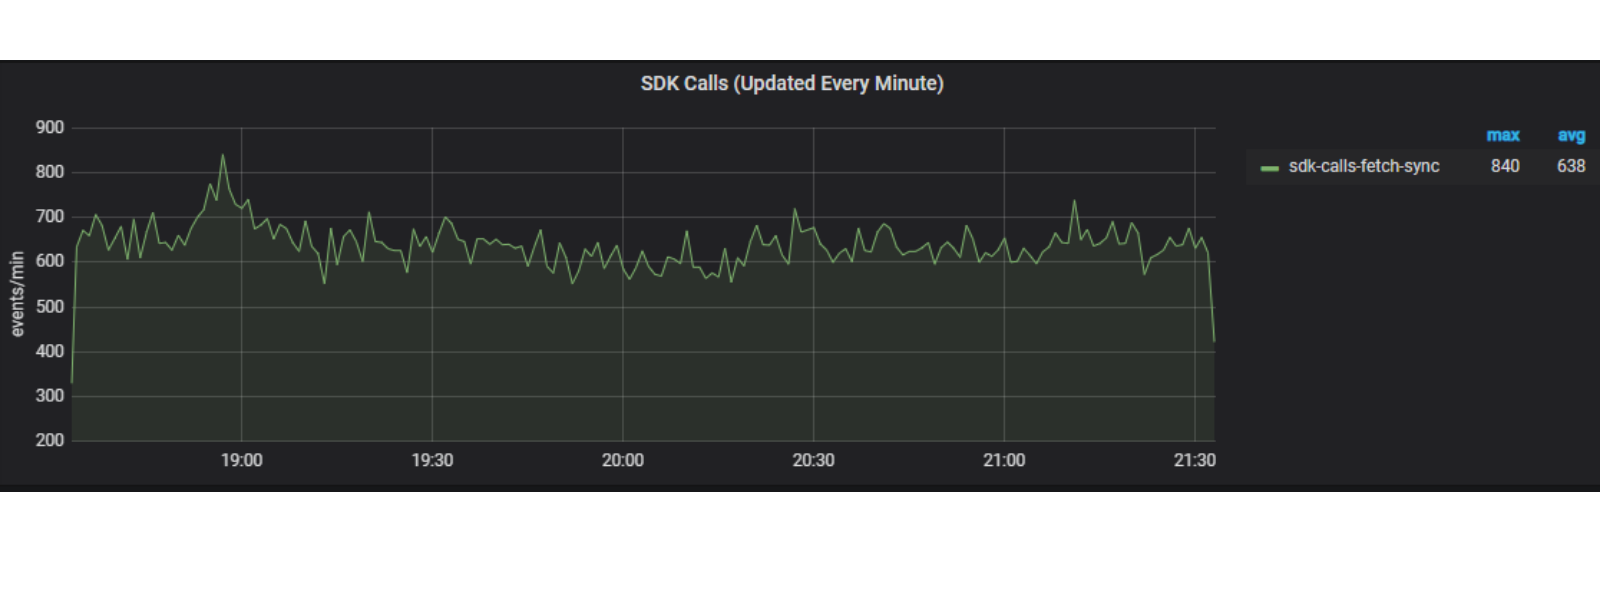
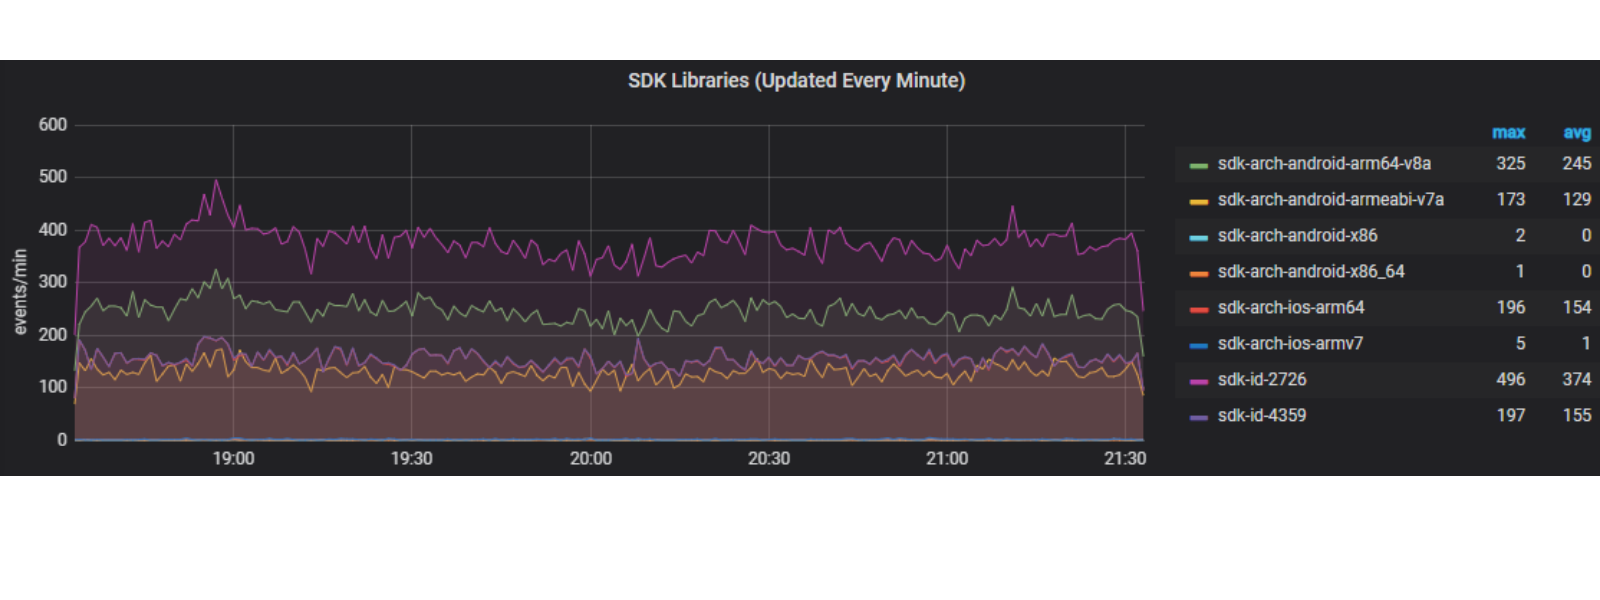
The SDK Metrics are very useful for understanding how your app is using the Approov SDK interface and the sorts of errors it is experiencing in the field. Again, this is vital information which provides real-time insight that would otherwise be really hard to get.
By now, you will only have one question: how do I get to these analytics? Well, the metrics are accessed via the Approov Command Line Interface (CLI) and the detailed documentation is here. The Approov Metrics give our customers great insight into what is happening inside their service, and hence what experience their mobile app customers are having. Further, examining the metrics data can expose issues such as forgetting to register a new app version very quickly, allowing corrective action to be taken. Finally, looking at the failure modes helps our customers to evolve and optimize their security policies.
The metrics data is a valuable capability that will guide you to manage your deployments and to get the most out of your Approov service.

- Advisor at Approov / Former CEO of Approov
30+ years experience in security products, embedded software tools, design services, design automation tools, chip design.